

What is Life Cycle Assessment (LCA) and why it is crucial for making responsible business decisions
LCA: What it is and how it works
Life Cycle Assessment (LCA) is a tool your company can use to assess the potential environmental and/or social impacts of the materials, products, services, or projects. It is especially useful during the designing phase to show you how to prioritize your time and effort regarding product or service design. You can use the assessment to inform various stakeholders: industry organisations, corporations, national governments, regulatory agencies at the local, national, and international levels, consumer organisations, non-governmental organisations (NGOs), environmental groups, and consumers. LCA can provide you with conclusions on critical points of improvement of your impact as well as scenarios for how the impact might vary if you altered one or more components in your system.
LCA helps you evaluate the consequences of greenhouse gas emissions, energy usage, water consumption, air and water pollution, land use, and resource depletion. It shows you detected “hotspots” where the most severe impacts occur, allowing you to prioritise areas for improvement. LCA allows for comparisons of various materials, technology, or processes to determine the most ecologically friendly solutions. The analysis takes into account the interdependence of impacts and helps you discover trade-offs, such as lowering one at the expense of increasing another.
LCA can model the impacts of changes such as using recycled materials, updating production processes, or changing transportation methods to determine the outcome of such changes. Analysis can quantify the environmental benefits of measures such as energy efficiency improvements, waste reduction, or material substitution. In addition to environmental factors, social LCA also includes different impacts directly on people to assess the social and socioeconomic impacts of a product or an activity.
It answers questions:
- “Is option X better than option Y?”
- “What are the impacts of a product or process?”
- “Where are the opportunities for improvement?”
- “What are the trade-offs between different impacts?”
- “What can be improved and how?”
- “How will different changes in the life cycle affect performance?”
- “What are the potential benefits of a product or process improvement?”
The types of LCA.
LCA is designed, structured, and calculated following the principles and framework for life cycle assessment defined in two ISO standards: ISO 14040:2006 and ISO 14044:2006. Both ISO 14040:2006 and ISO 14044:2006 introduce and further define goal and scope, life cycle inventory analysis (LCI), life cycle impact assessment (LCIA), life cycle interpretation, reporting, and critical review of the LCA.
If we evaluate LCAs based on the level of analysis and their compatibility with ISO criteria, we may distinguish three categories:
- Streamlined LCA (synonyms: conceptual LCA or Life Cycle Thinking)
- Fast-track LCA (synonyms: simplified, lean, or screening LCA)
- Full LCA (synonyms: detailed or rigorous LCA)
Streamlined LCA is an environmental impact assessment that you can do fast, employing limited and often qualitative inventory. However, you cannot use the results of such an evaluation for marketing or public distribution. Streamlined LCA serves to check options. Its results are rather used to inform decision-making by identifying materials and supplier combinations that could result in reduced environmental impacts. Moreover, in the early stages of design, you cannot do a precise LCA anyway because you don’t have the necessary data.
Once you’ve established feasibility and decided on design options, you can do fast-track LCA. Fast-track LCA can be done in a short time as it takes hours, rather than days or weeks. It uses generic data and standard modules for energy production. It serves to identify the biggest impacts and set goals. It focuses on the most important environmental aspects and phases of the life cycle.
Full LCA has to be performed following to aforementioned ISO standards. It is complex, it usually takes three to six months and costs a lot. Most companies hire specialized consultants to do it. Full LCA requires significant data gathering, with a special focus on the aim of the LCA and all data must be obtained specifically for the product or service under examination. It serves to certify a product according to ISO 14040 or environmental product declaration (EDP). You can perform it once the product design cycle is complete and you have all the necessary product data.
The phases of LCA.
Every LCA process consists of the following phases:
- Defining goal and scope
- Defining system boundary
- Compiling system inventory (Lifecycle Inventory – LCI)
- Calculating impacts (Lifecycle Impact Assessment – LCIA)
- Interpreting results
Goal and scope.
The goal represents what you want to achieve with your LCA. Scope explains why are you doing the LCA and how are you going to achieve the goal. To establish the scope, you need to first define the “Functional Unit”. The Functional Unit describes the functional specification of the product or service and the aim of the design inventory.
An example of a functional unit is one pair of pants made out of cotton that will be used for 100 days. If you were measuring the impact of a transport system, you could define it as 100m3 of cargo over a distance of 1.000km with no payload on the way back. Or if you’re measuring the impact of a coffee machine, it would be defined as 2.000 coffee cups per year or 50.000 coffee cups over the lifetime.
You have to be careful when defining the functional unit because there is a possibility of wrongly framing the goal of the analysis and therefore the results. If you are trying to determine eg. which coffee cup has a lower impact by comparing a single-use takeaway paper cup and a ceramic multi-use coffee cup, the wrong choice of the functional unit could lead to wrong conclusions. It would be incorrect to compare the two cups based on product impact. The ceramic cup would undoubtedly lose since its manufacturing phase would have a higher impact than that of the paper cup. Comparing cup production processes would also be an incorrect functional unit because ceramic coffee cups are reusable, whereas paper coffee cups are often discarded after a single use.
Therefore, to frame this correctly, you should analyse the environmental consequences of the number of cups of coffee consumed. In this approach, apart from the impactful production phase of a coffee mug, you would also account for the end-of-life impact of numerous discarded paper cups, as opposed to a ceramic cup’s considerably longer lifetime. To properly define the functional unit, we shall declare it as the environmental impact of drinking 250 ml of coffee.
Another challenge in correctly defining the functional unit is when your system simultaneously achieves many different functions. One such example is wheat crop production. Wheat crop achieves multiple functions: upkeeps landscape (functional unit would be environmental impacts reported per unit of surface area for 1ha of wheat crop), produces fodder wheat (functional unit would be environmental impacts reported per 1t of produced grains), or produces quality wheat for bread-making (functional unit would be environmental impacts reported per 1t of grains with a 13% protein content).
System boundary.
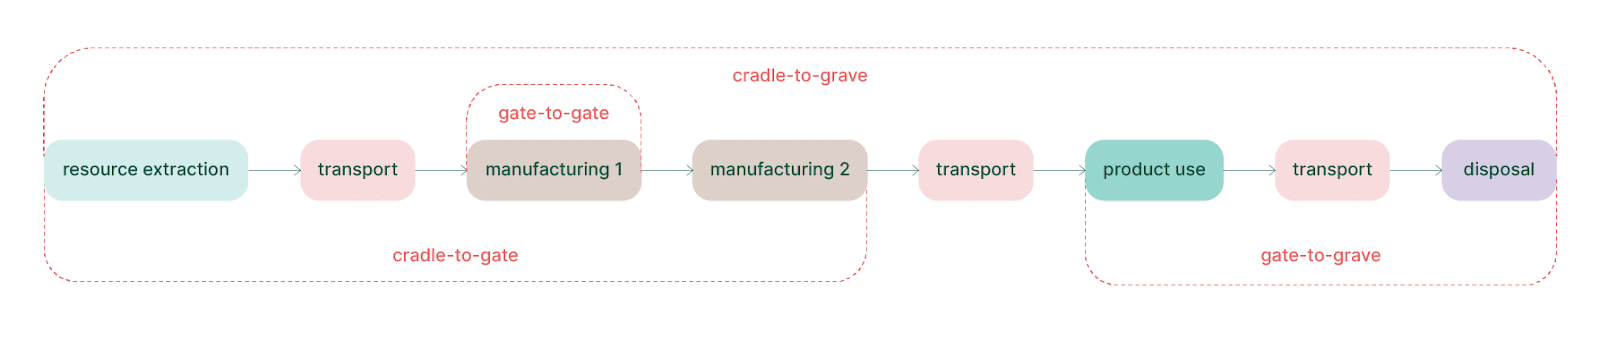
After you define the functional unit, it’s time to define the system boundary. System boundary shows where the system you’re looking to study ends, what you include in it, and what is excluded. The most often used system boundaries are:
- Cradle-to-gate – starts with the extraction of raw materials and ends when the final product leaves your factory
- Cradle-to-grave – starts with the extraction of raw materials and ends when the final product is discarded
- Cradle-to-cradle – starts with the raw material extraction stage and ends at the end-of-life phase when the product is recycled
- Gate-to-grave – starts with the customer use phase and ends when the final product is discarded
- Gate-to-gate – you use it when you’re comparing two different materials or two different manufacturing processes
System inventory.
To build a complete system inventory it’s best to next draw a flowchart to ensure you include every production, transport, and use phase. The flowchart gives a simple overview of the processes and their relationship. If we go back to our example of a cotton pair of pants, the flowchart would look like this:
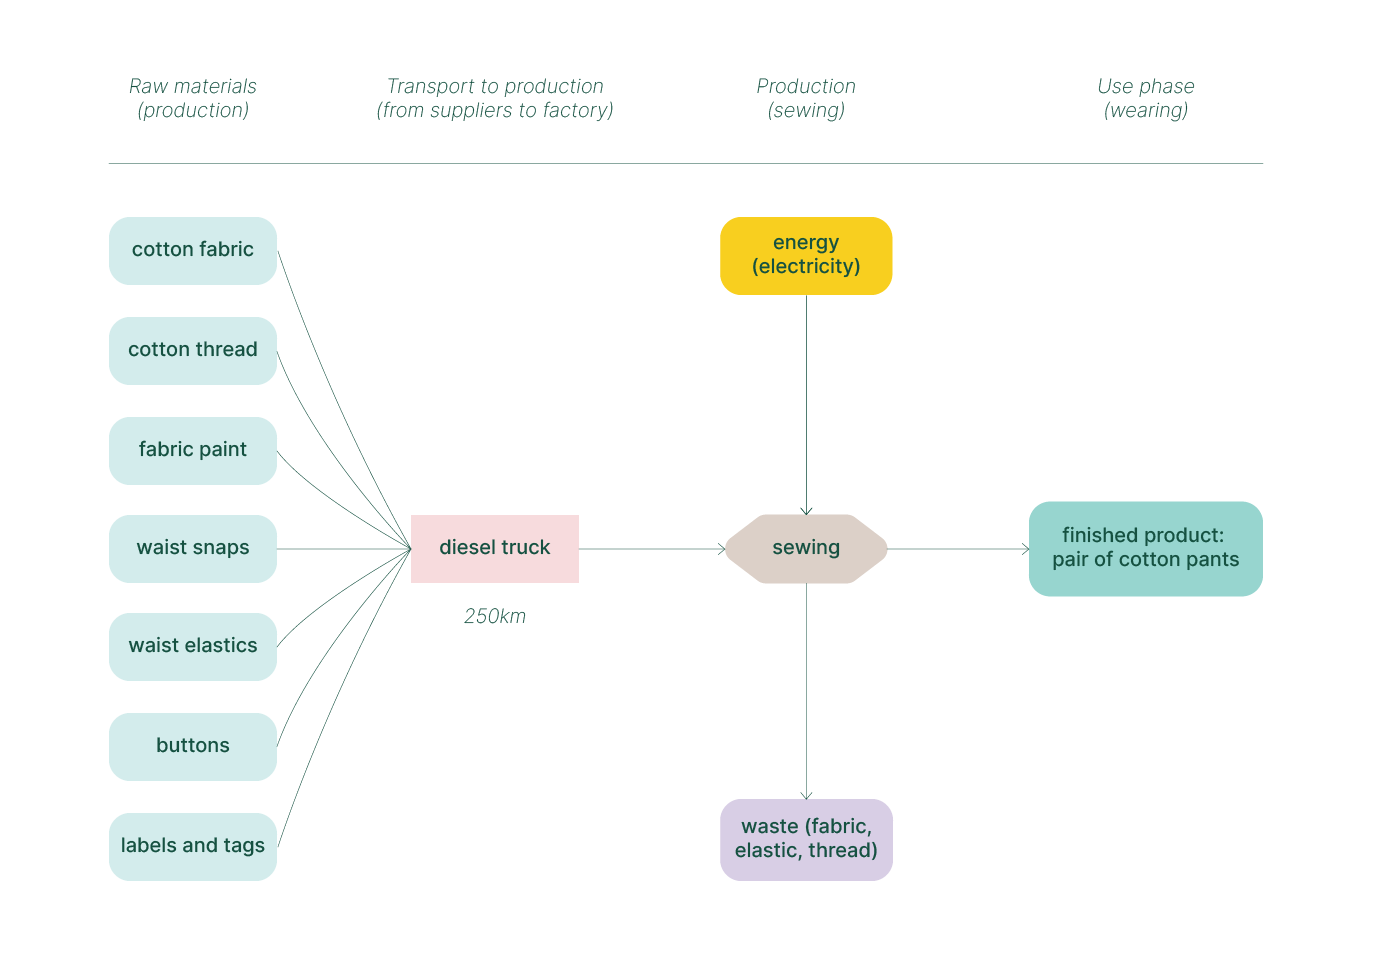
Certainly, the flowchart above is a simplified representation of your system. In case you don’t have data on the impact of the cotton fabric production from your supplier, you would have to include data on farming, fiber production, yarn production, fabric production, and dying. As far as transport goes, it would usually also include shipping, unless you get all of your supplies in one place. Your production process might also be outsourced, and then the final phase would include transporting the pants to the retailer. Your system might be more complex and include a use phase and end-of-life phase, also including calculations on the number of washes during the lifecycle of the product and the type of detergent used in the process. However your flowchart might differ from the one presented above, it is important to include all of the details on all of the phases that are included in the goal of the study. You will need to know where the materials were grown, and processed, and what were the inputs and outputs.
After clarifying the processes that make up your product, you will compile the inventory as a table listing all the raw materials (bill of materials) that go into the product, their quantity, the manufacturing methods, the means of transportation, the energy used during its lifetime, where the energy comes from, and what happens at the end of life.
Calculating impacts.
The next step of your impact assessment is calculating impacts. The most widely used software are SimaPro, GaBi, OpenLCA, and Ecochain Mobius. Each software contains databases that you can use to compile the inventory in case you’re missing the data from suppliers.
Data can be primary (data you get from suppliers) and secondary (average data you get from databases). Primary data is certainly more accurate, secondary data is used to fill in the gaps. Databases are compiled by researchers and research companies and you usually buy them with the LCA calculation software. Examples of databases are ecoinvent, AGRIBALYSE (agricultural), Quantis World Food LCA database (food production), GaBi database, USLCI (US EPA), and Idemat (Industrial Design and Engineering MATerials database).
Before calculating impacts, you need to collect and validate data and translate all results into a single indicator following four steps:
- Classification
- Characterisation
- Normalisation
- weighting
Classification.
During classification, you are grouping emissions for each type of impact category (e.g. global warming, acidification, etc). You are choosing the impact categories you will consider and classify the inventory information per each category. Some of these are global warming potential (GWP), eutrophication potential, land use, water footprint, impact on biodiversity, air pollution, and acidification potential. In case you can’t collect enough data to justify parts of the study, the affected impact categories must be excluded.
Characterisation.
During characterisation, you will use characterization factors to combine element flows into one indicator per impact category. If you look at the impact of your product on GWP, this would mean using emissions factors to combine and express each of the greenhouse gases into carbon dioxide equivalents (CO2e). Once aligned, you will be able to compare them.
Normalization.
After you compile your inventory list in the software of choice and select the appropriate impacts from the appropriate database, you need to decide how all the environmental impacts will be weighed and normalized. Without normalization, you would be comparing apples to oranges. However, there is a way to compare different impacts to one another, such as ozone depletion to mineral depletion. During the process of normalization, impacts get translated into three classes: human health impact, ecosystem health, and resource cost increase. Eg. human health impact tells us how likely is an average person to die a year earlier because of one of these impacts. This step allows you to compare the corresponding emissions to the total emissions for that class in the EU or globally.
Weighing.
In the process of weighing, these three classes are weighed into a single result. You will use models to weigh the LCI data into one single indicator and render the results comparable and understandable. The most widely used methods are ReCiPe 2016 (a damage-based model), Traci by USA EPA (resource depletion method), the eco-costs 2022 (a prevention-based model), or the carbon footprint.
Interpreting results.
The results of the LCA will help you identify where the hotspots of your impacts are, prioritize improvement areas across the supply chain, and understand how to improve. If you compared a couple of manufacturing techniques or production materials, you would be able to select the one with the lowest impact.
The phase of result interpretation is characterized by uncertainty and sensitivity. Even if you have accurate supplier data, the estimation of impacts will come with some level of uncertainty (10% or more). Sensitivity shows you how data changes if you change the scenarios. It is important to understand how the product will be used before you start your analysis so that you can model the right scenarios. For example, the scenario model for the use phase of a coffee machine will be different in an assessment of a retailer that sells the product to bars that make hundreds of cups a day and of a retailer that sells it to consumers that make a couple of cups a day. These will differ in energy consumption and lifetime due to use intensity.
Why do an LCA?
Depending on what phase your product or service development is in, LCA can serve different purposes. Even while LCA is currently optional and its evaluation and verification are not yet mandated by law, they are widely regarded as best practices to guarantee the validity and dependability of the findings.
It can provide insights for marketing, public policy, product creation and improvement, strategic planning, and operational transparency. LCAs may reduce waste and optimise resource use, which can save costs and increase the productivity of your process or product.
It might help you evaluate suppliers, minimise emissions in supply chains, develop engagement strategies to diminish the impact of suppliers, and make environmentally friendly procurement decisions. Further benefits might include improved brand recognition for the company and increased customer confidence.
LCA can present a competitive advantage and drive innovation through environmental performance optimization. It could also provide your company a competitive edge in the marketplace, by achieving regulatory compliance and future-proofing business operations.
Depending on the LCA’s objective, a critical evaluation may or may not be necessary. To guarantee their correctness and dependability, LCAs used to prepare Environmental Product Declarations (EPDs) usually need to undergo a rigorous evaluation by a third party. This verification provides a guarantee that the LCA results are based on reliable scientific concepts and that the LCA and EPD adhere to strict quality requirements.
The challenges of LCA.
When doing an LCA, it is necessary to accurately define the impact categories, the calculation methods, the quality and accessibility of the data, and the extent of the study. Data availability and quality are essential. Proxies are frequently used as a direct replacement or added to existing components to build upon them to fill in the gaps for certain materials or processes due to data availability limitations.
Detailed LCAs usually take a month or several months to complete. Long or complicated supply chains, especially those with several manufacturing or consumption phases, make LCAs more difficult, time-consuming, and data-intensive.
Inadequately performed LCAs depend on data that will provide the business with a preferred outcome, fail to consider the whole impact lifespan or offer neither transparency nor an unbiased evaluation of the process. Although doing an LCA can be a difficult and time-consuming procedure, it can also be a useful tool for deciding how to make a product or brand more sustainable.
Pingback: Sustainability Strategies for Outdoor Business: Reducing Carbon Footprint — Ana Maksimovic - corporate sustainability consultant